How to Build Burnup Charts
The Competitive Edge for Modern Project Managers
How to Build a Sprint Burnup Chart (Using the Template)
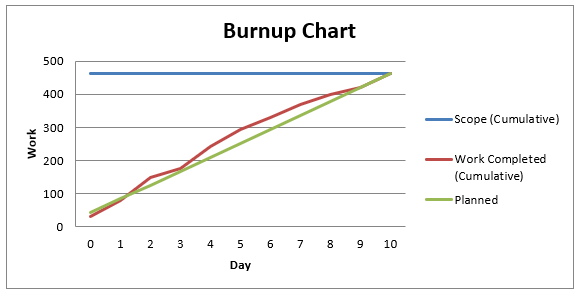
A burnup chart shows how much work has been completed over time compared to the total scope. It’s great for visualizing progress and for making scope changes visible. This guide explains how to fill in the Excel template and produce a clear burnup chart.
Donwload templates in Downlaods
What’s in the Template
- Day – Sprint day number (starts at 0).
- Completed Planned – Story points you plan to complete on that day.
- Completed Actual – Story points actually completed on that day.
- Cumulative Planned – Running total of planned completed points.
- Cumulative Actual – Running total of actual completed points.
- Total Scope – The current scope line (can change if scope goes up or down).
Before You Start
- Total sprint scope (sum of committed story points at Sprint Planning).
- Sprint length (how many days you’ll track).
- Daily plan (even distribution or capacity-based plan by day).
Step 1 — Set the Sprint Length
- Open the template and check the Day column.
- Extend or trim it to match your sprint (for example, Day 0 to Day 10 for an 11-day sprint).
- If you track weekends, keep them and plan 0 for those days as needed.
Step 2 — Enter Total Scope
- In the Total Scope column, enter your initial scope (e.g., 460) for all rows of the sprint.
- This creates a flat scope line. You will adjust it later if scope changes.
Step 3 — Plan Daily Completions
Fill the Completed Planned column for each day (not Day 0). Two common options:
- Even plan: total_scope ÷ number_of_days (e.g., 460 ÷ 23 ≈ 20 per day).
- Capacity-based plan: vary the numbers by team availability (e.g., 0 on weekends, more on focus days).
Step 4 — Calculate Cumulative Planned
Use a running sum so the planned completion grows over time. Assuming headers are in row 1 and data begins in row 2, and these columns:
- A: Day
- B: Completed Planned
- C: Completed Actual
- D: Cumulative Planned
- E: Cumulative Actual
- F: Total Scope
Example formulas (adjust to your sheet):
- In D2 (Day 0):
=0 - In D3 (Day 1):
=D2 + B3, then copy down to the last day.
Step 5 — Track Actual Completion Daily
- Each day, enter what was completed in Completed Actual (column C).
- Calculate Cumulative Actual with a running sum:
- In E2 (Day 0):
=0 - In E3 (Day 1):
=E2 + C3, then copy down.
- In E2 (Day 0):
Step 6 — Handle Scope Changes
- Scope increase: On the day scope rises by, say, 20 points, update Total Scope from that day onward by
+20(e.g., replace remaining rows in column F with the new higher value). - Scope decrease: Similarly, reduce Total Scope from that day onward by the removed points.
- This creates a stepped scope line so changes are visible on the chart.
Step 7 — Create (or Refresh) the Chart
- Select Day, Cumulative Planned, Cumulative Actual, and Total Scope columns.
- Insert a Line chart (or “Line with markers”).
- Ensure the X-axis is Day and the three series are:
- Cumulative Planned (planned progress)
- Cumulative Actual (actual progress)
- Total Scope (scope line)
- Give the chart a clear title (e.g., “Sprint 14 Burnup”).
How to Read the Burnup
- Cumulative Actual grows upward as work is completed.
- Total Scope shows your finish line; if it moves, scope changed.
- Cumulative Planned is your target trajectory. If actual is below it, you’re behind plan; if above, you’re ahead.
Common Real-World Situations
- Weekends / Holidays: Put 0 in Completed Planned and Completed Actual for those days. The cumulative lines will flatten naturally.
- Partial completions: Only add points when items meet your “Done” definition, unless your team explicitly allows partials.
- Late discoveries: If new work appears, reflect it by raising the Total Scope line from that day onward.
Quality Checks
- The final Cumulative Planned value on the last day should be less than or equal to the final Total Scope. If you planned to finish everything, it should match the final scope.
- The final Cumulative Actual shows how much was truly completed. If it’s below the final scope, you have carryover.
- If cumulative values don’t look right, re-check the running-sum formulas and cell references.
Daily Routine
- At day’s end, update Completed Actual.
- Adjust Total Scope if scope changed that day.
- Glance at the chart: Is Cumulative Actual trending toward the scope line?
Tips for Better Forecasting
- Use the gap between Cumulative Actual and Total Scope to discuss likelihood of finishing on time.
- Watch for scope creep; the Total Scope line will make it visible immediately.
- Refine next sprint’s plan using recent actual throughput (velocity).
Summary
Fill daily Completed Planned and Completed Actual, let the template calculate Cumulative Planned and Cumulative Actual, and keep Total Scope accurate—especially when scope changes. The burnup chart then gives a truthful picture of progress versus scope so you can make better, earlier decisions.
| Day | Scope (Cumulative) | Scope | Work Complete | Work Completed (Cumulative) |
|---|---|---|---|---|
| 0 | 462 | 42 | 32 | 32 |
| 1 | 462 | 84 | 46 | 78 |
| 2 | 462 | 126 | 70 | 148 |
| 3 | 462 | 168 | 28 | 176 |
| 4 | 462 | 210 | 66 | 242 |
| 5 | 462 | 252 | 52 | 294 |
| 6 | 462 | 294 | 37 | 331 |
| 7 | 462 | 336 | 39 | 370 |
| 8 | 462 | 378 | 30 | 400 |
| 9 | 462 | 420 | 20 | 420 |
| 10 | 462 | 462 | 42 | 462 |
How To Land the Job and Interview for Project Managers Course
Take the next big step in your project management career with HK School of Management. Whether you're breaking into the field or aiming for your dream job, this course gives you the tools to stand out, impress in interviews, and secure the role you deserve.
This isn’t just another job-hunting guide—it’s a tailored roadmap for project managers. You’ll craft winning resumes, tackle tough interview questions, and plan your first 90 days with confidence. Our hands-on approach includes real-world examples, AI-powered resume hacks, and interactive exercises to sharpen your skills.
You'll navigate the hiring process like a pro, with expert insights on personal branding, salary negotiation, and career growth strategies. Plus, downloadable templates and step-by-step guidance ensure you're always prepared.
Learn from seasoned professionals and join a community of ambitious project managers. Ready to land your ideal job and thrive in your career? Enroll now and take control of your future!

Launch your career!
HK School of Management provides world-class training in Project Management, Lean Six Sigma, and Agile Methodologies. Just for the price of a lunch you can transform your career, and reach new heights. With 30 days money-back guarantee, there is no risk.
Learn More