How to Build Risk Burndown Charts
The Competitive Edge for Modern Project Managers
How to Build an Agile Risk Matrix & Risk Burndown (Using the Template)
This guide shows you how to use the Excel template to track risks, visualize them on a risk matrix, and chart how overall risk exposure drops over time with a risk burndown. Follow the steps in order and you’ll get clean, useful visuals for your sprint reviews and retrospectives.
Donwload templates in Downlaods
What’s in the Template
- Risk Register – a table for all risks and attributes (ID, title, owner, probability, impact, score, response, status, dates).
- Risk Matrix – a 5×5 (or 1–10 scaled) grid showing risk severity by Probability × Impact, usually colored green/yellow/red.
- Risk Burndown – a line chart showing total risk exposure over time (by day or sprint).
Before You Start
- Define your scales:
- Probability: 1 (rare) to 5 (almost certain) — or 1 to 10.
- Impact: 1 (minor) to 5 (critical) — or 1 to 10.
- Decide your time index for the burndown (e.g., daily dates or Sprint 1, Sprint 2, …).
- Agree on risk response types (avoid, reduce/mitigate, transfer, accept) and a simple status workflow (Open, Mitigating, Closed).
Part A — Fill the Risk Register
- Open the Risk Register sheet and add one row per risk. Suggested columns:
- Risk ID (e.g., R-01)
- Title / Description
- Owner
- Probability (1–5)
- Impact (1–5)
- Score (formula)
- Response (avoid / reduce / transfer / accept)
- Status (Open / Mitigating / Closed)
- Identified On (date)
- Target Closure (date)
- Closed On (date, optional)
- Notes
- Calculate Score:
- In the Score column (say, column G), use
=Probability * Impact. For example, if Probability is in D2 and Impact is in E2, then in G2 enter:=D2 * E2
- In the Score column (say, column G), use
- (Optional) If you evaluate pre-mitigation and post-mitigation values, add columns:
- Pre-Prob, Pre-Impact, Pre-Score =
=Pre-Prob * Pre-Impact - Post-Prob, Post-Impact, Post-Score =
=Post-Prob * Post-Impact
- Pre-Prob, Pre-Impact, Pre-Score =
Part B — Build the Risk Matrix
You have two common ways to visualize the matrix: a heatmap grid with counts per cell, or a bubble scatter with one point per risk.
Option 1 — Heatmap Grid (Counts per Cell)
- Create a 5×5 table with Impact on the X-axis (columns 1 to 5) and Probability on the Y-axis (rows 1 to 5). Label headers clearly.
- In each cell, count how many risks fall into that exact (Prob, Impact) pair using
COUNTIFS. Example (for Prob=3, Impact=4):=COUNTIFS(ProbRange,3, ImpactRange,4) - Apply Conditional Formatting → Color Scales or build a custom rule so higher counts (and/or higher cell severity like 4×5, 5×5) show in deeper red.
- (Optional) Compute a severity weight per cell (e.g.,
row_prob * col_impact) and use it to color intensity.
Option 2 — Bubble/Scatter (One Point per Risk)
- Select three columns from your register: Impact (X), Probability (Y), and Score (bubble size).
- Insert → Bubble (or XY Scatter with varying bubble size).
- Format the axes to show integer ticks 1–5 (or 1–10) and add gridlines.
- (Optional) Use series or labels to highlight high-severity risks (Score ≥ 15).
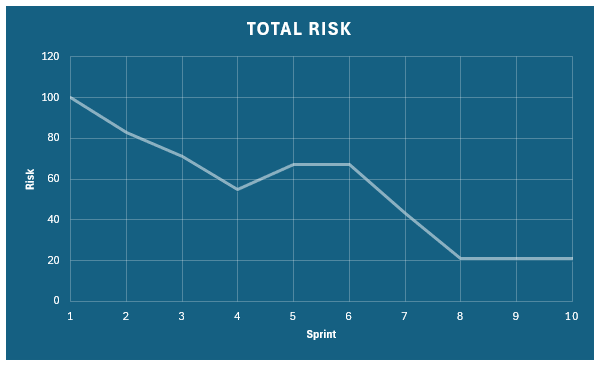
Part C — Build the Risk Burndown
The Risk Burndown shows how total risk exposure drops over time. You can plot:
- Total Risk Exposure (TRE): Sum of Score for all Open risks on a given day/sprint.
- (Optional) Plot separate lines for Pre-Score and Post-Score to show effect of mitigations.
Step 1 — Create a Time Index
- In a Burndown sheet, create a column for Date (or Sprint #).
- List each day (or each sprint boundary) you want to track.
Step 2 — Calculate TRE per Date/Sprint
Use SUMIFS to sum scores for risks that are open on a given date (identified but not yet closed).
- Assume:
- Score in G:G
- Status in H:H (Open/Mitigating/Closed)
- Identified On in I:I
- Closed On in K:K (blank if not closed)
- For a given date in cell B2 (timeline), TRE formula (risks active on that date) can be:
=SUMIFS(G:G, I:I, "<=" & B2, K:K, ">" & B2) + SUMIFS(G:G, I:I, "<=" & B2, K:K, "")
This adds scores for risks identified on or before the date and either closed after the date or not closed yet. - Alternatively, if you prefer simple “Open status” logic:
=SUMIFS(G:G, H:H, "Open")
Use this when you snapshot the register once per time point.
Step 3 — Insert the Chart
- Select Date/Sprint and the calculated TRE column.
- Insert → Line chart (or “Line with markers”).
- Title the chart (e.g., “Risk Burndown”). The line should trend down as mitigations close risks or reduce scores.
Working Agreements (to Keep the Charts Honest)
- One owner per risk. Accountability speeds mitigation.
- Update probability/impact only when justified. Note the reason in Notes.
- Close risks only when exposure is removed. If reduced but still present, keep it Open and adjust Post-Score.
Common Real-World Situations
- New risks mid-sprint: Add them immediately; the matrix and burndown should jump the same day.
- Mitigation in progress: Reduce Probability and/or Impact to reflect residual exposure, but keep Status = Open until fully addressed.
- Merged/duplicated risks: Consolidate and keep a trace in Notes to preserve history.
- Multiple products/teams: Add a Team or Component column and filter the matrix/burndown by team when needed.
Quality Checks
- Scale bounds: Probability and Impact must be within your chosen scale (1–5 or 1–10).
- Score math: Confirm Score = Probability × Impact for each row.
- Dates logic: Identified On ≤ Closed On (when closed). No future dates.
- Burndown consistency: TRE should decrease when risks are closed or scores are reduced; it should increase when risks are added or scores rise.
Daily/Weekly Routine
- Review new and existing risks during standup/backlog refinement.
- Update the register (probability, impact, status, dates).
- Refresh the Risk Matrix and Risk Burndown.
- Call out top 3–5 risks, agreed mitigations, and owners.
Tips for Better Decisions
- Use the matrix to prioritize: tackle high-probability/high-impact items first.
- Track residual risk explicitly (post-mitigation scores) to show the effect of actions.
- Pair the burndown with a short risk narrative in reviews: what changed and why.
Summary
Enter risks in the register, calculate Score = Probability × Impact, and visualize them via a Risk Matrix (heatmap or bubble). Then compute Total Risk Exposure across time points and chart it as a Risk Burndown. Keep data current and the visuals will guide timely, confident decisions.
| Story | Sprint 1 | Sprint 2 | Sprint 3 | Sprint 4 | Sprint 5 | Sprint 6 | Sprint 7 | Sprint 8 | Sprint 9 | Sprint 10 | Total Risk |
|---|---|---|---|---|---|---|---|---|---|---|---|
| Story 1 | 15 | 12 | 10 | 8 | 7 | 6 | 5 | 3 | 2 | 2 | 100 |
| Story 2 | 12 | 10 | 8 | 6 | 7 | 7 | 5 | 2 | 2 | 2 | 83 |
| Story 3 | 10 | 8 | 7 | 6 | 6 | 7 | 4 | 2 | 2 | 2 | 71 |
| Story 4 | 12 | 9 | 8 | 6 | 7 | 7 | 4 | 2 | 2 | 2 | 55 |
| Story 5 | 10 | 8 | 7 | 6 | 6 | 6 | 4 | 2 | 2 | 2 | 67 |
| Story 6 | 9 | 8 | 7 | 6 | 7 | 7 | 5 | 2 | 2 | 2 | 67 |
| Story 7 | 8 | 7 | 6 | 5 | 6 | 7 | 5 | 2 | 2 | 2 | 43 |
| Story 8 | 8 | 7 | 6 | 4 | 7 | 6 | 4 | 2 | 2 | 2 | 21 |
| Story 9 | 8 | 7 | 6 | 4 | 7 | 7 | 4 | 2 | 2 | 2 | 21 |
| Story 10 | 8 | 7 | 6 | 4 | 7 | 7 | 3 | 2 | 3 | 3 | 21 |
| Total Risk | 100 | 83 | 71 | 55 | 67 | 67 | 43 | 21 | 21 | 21 |
Advanced Lean Six Sigma — Data-Driven Excellence
Solve complex problems, reduce variation, and improve performance with confidence. This course is designed for professionals who already know the basics and want to apply advanced Lean Six Sigma tools to real business challenges.
This is not abstract statistics or theory-heavy training. You’ll use Excel to perform real analysis, interpret results correctly, and apply tools like DMAIC, SIPOC, MSA, hypothesis testing, and regression without memorizing formulas or relying on expensive software.
You’ll learn how to measure baseline performance, analyze process capability, use control charts to maintain stability, and validate improvements using statistical evidence. Templates, worked examples, and structured walkthroughs help you apply each concept immediately.
Learn through a complete, real-world Lean Six Sigma project and develop the skills to lead data-driven improvements with credibility. If you’re ready to move beyond basics and make decisions backed by data, enroll now and take your Lean Six Sigma expertise to the next level.

Become an AI-First Agile Leader!
HK School of Management empowers you to master AI as your most powerful co-pilot—without the complexity. Transform your agile leadership with practical, prompt-based workflows and proven strategies designed for real-world scrum challenges. For the price of lunch, you get the tools to automate mundane tasks, refine backlogs with precision, and drive unprecedented efficiency in your team. Backed by our 30-day money-back guarantee—zero risk, real impact.
Learn More