Quality Control Measurements

Recorded outputs from performing Control Quality that show how products or processes actually performed against defined quality metrics.

Key Points

  • They are the output of the Control Quality process and capture actual inspection and test results.
  • Values may be numeric (e.g., defect counts, dimensions) or categorical (e.g., pass/fail) and are traceable to specific quality metrics.
  • They feed Manage Quality and analysis tools (e.g., trend charts) to drive process improvements and corrective actions.
  • They are stored as project records to support decisions, change requests, and lessons learned.

Example

On a software project, the team runs system tests and logs 38 defects with severity levels, pass/fail rates for 250 test cases, and response time measurements versus targets. These logged figures are the quality control measurements used to assess compliance and to plan fixes.

PMP Example Question

Which artifact should the project manager review to see the actual results from inspections and tests performed during Control Quality?

  1. Quality control measurements
  2. Quality metrics
  3. Quality management plan
  4. Verified deliverables

Correct Answer: A — Quality control measurements

Explanation: Quality control measurements contain the documented results from Control Quality. Metrics define targets, the plan explains the approach, and verified deliverables are items that passed inspection.
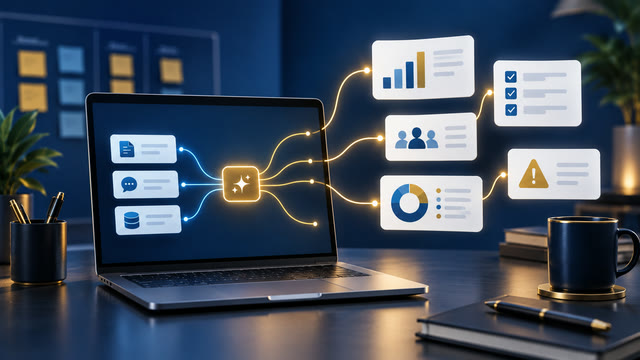
AI Systems with Claude, for Scrum Masters and Project Managers

Most AI pilots in project management do not fail on the model. They fail because somebody pointed the thing at a decision instead of at a task. This course is built around that distinction, and around the work that follows once you get it right.

Eight teaching sections, taught against one running project from the first lecture to the last. You watch a system get built, then you build the same one against your own sprint. Nothing here is a demo that works only on the example.

You finish with five working systems and you keep them. The sprint report machine turns your board export and standup notes into the report you currently write by hand. The retro intelligence system tells you what the team keeps saying, not just what it said this time. The stakeholder comms engine drafts the update in the register the audience expects. The backlog health monitor flags the quiet decay nobody has time to check for. The risk and dependency tracker follows the chains that actually bite.

Seventy-six working files ship with it, across four sections, so every system is built against real sprint data rather than material invented for a slide. Four sprints of retrospectives, board exports, standup notes, backlog and risk data.

Explore the Course


Take Control of Project Performance!

HK School of Management helps you go beyond status reports and gut feelings. In this advanced course, you will learn Earned Value Management (EVM) to measure progress, forecast outcomes, and take corrective action. Learn how WBS quality drives performance, how control accounts work, and how to use EAC, TCPI, and variance analysis. Practical skills, tools, and guidance you can apply right away. Covered by Udemy's 30-day refund policy.

Learn More